Chapter 4-9: Appx Chart Director API |
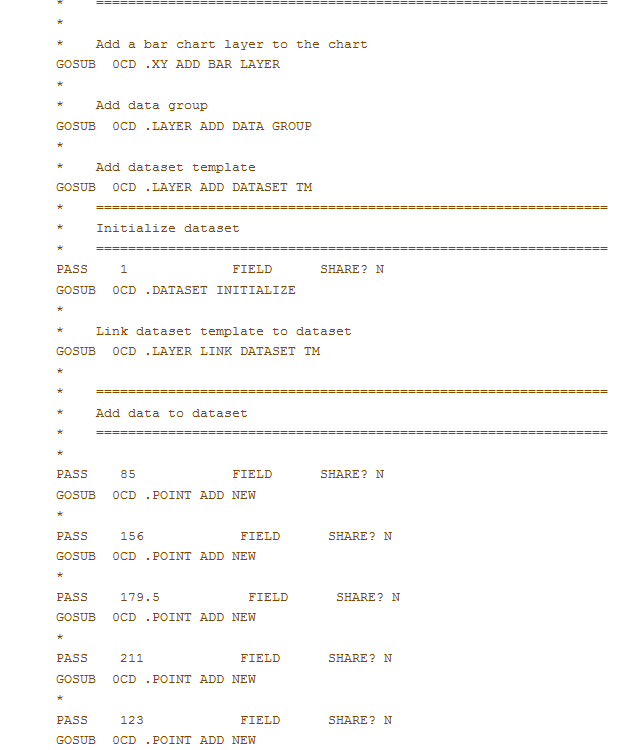
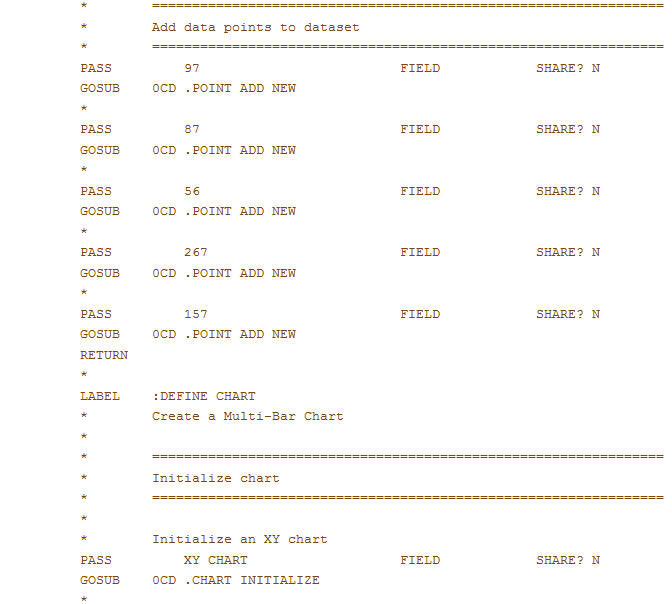
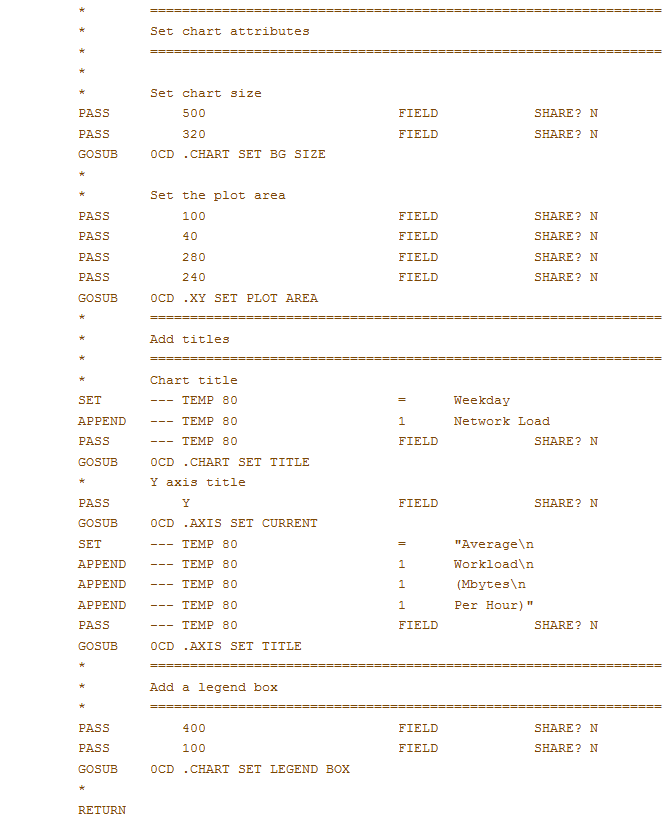
Defining a Dataset Data and the presentation of data on a chart is separated into distinct areas, by design. This allows you to have a process that produces a chart, but does not have to know anything about the data that is being charted. A separate process can accumulate the data to be charted, then simply run the other process to produce the chart. The actual data is organized into a particular structure: a 'data point' is the smallest unit and represents one unit of data and a 'data set' is a collection of related 'data points'. For presentation purposes, there is a 'data set template', a 'data group', which is a collection of 'data set templates' and a 'layer', which is a collection of 'data groups'. All of the above can be named, or not. If you are working with multiple layers, data groups, data set templates, or data sets, you can name them to make charting easier. If you only need one layer, data group, data set template, etc, then you can leave the names blank when you create them. Attributes of 'layers', 'data groups', and 'data set templates' can all be set individually; i.e., you can change the color or shape of all the bars in a 'data group' to make it different from other bars. The Layer type will determine how the data will be presented; i.e., you can have an XY layer type for bar charts, an Area layer for area charts, etc. You can render more than one layer on a chart, combining the various chart types. The data to be plotted on a chart is kept in a 'data set'. There is no specific limit to the number of 'points' in your dataset. You can also manage more than one dataset at a time by giving each dataset a unique name when you initialize it. The general flow is to initialize a dataset, then use various subroutines to add data to your dataset. When you initialize a Pie chart, a dataset is initialized automatically for you. If you already have a dataset initialized when you call the chart initialization routine for a Pie chart, then that dataset will be associated with the new chart. Certain chart types have specific routines for defining layers of data; e.g., a bar chart that plots more than one set of data. These are discussed under the API's for that particular chart type. Pie charts have a specific API that lets you add a datapoint and a label for it at the same time (see Chart design example). The following code illustrates adding a layer of data to a bar chart:
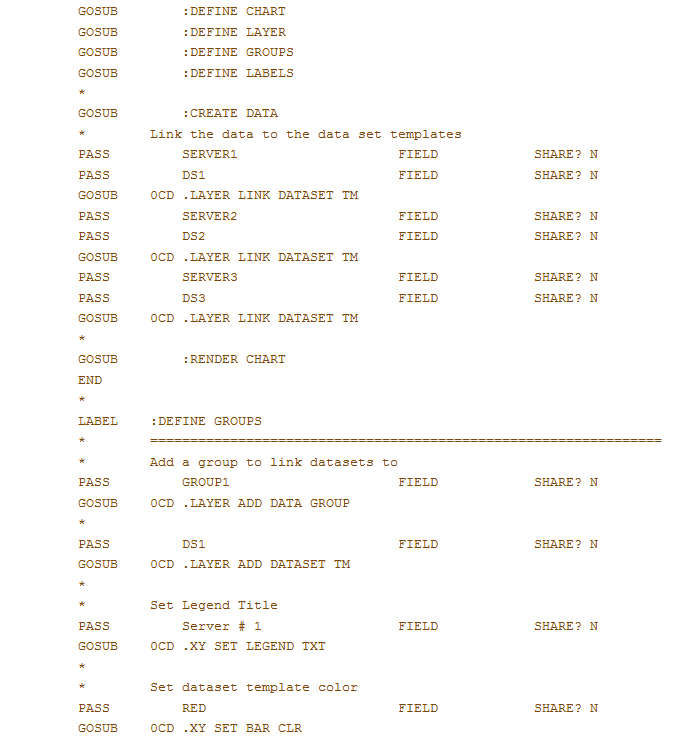
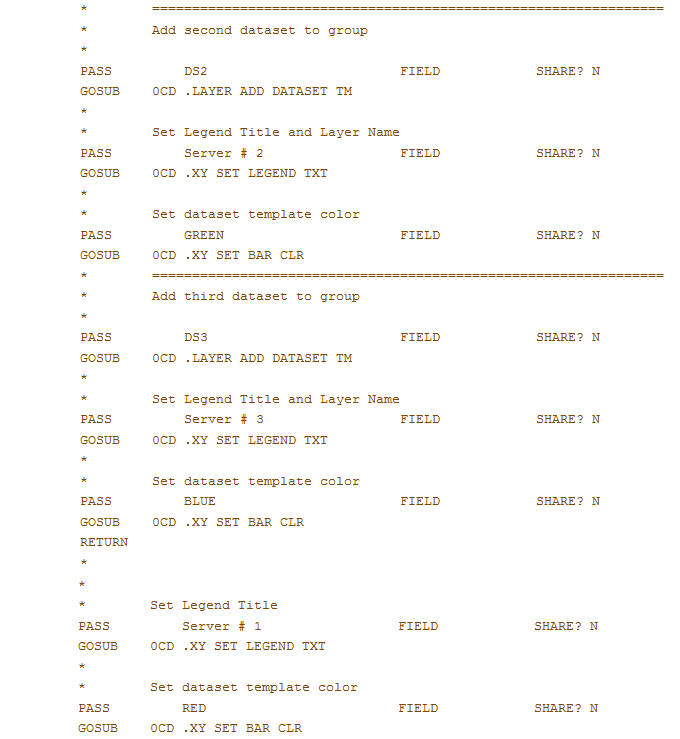
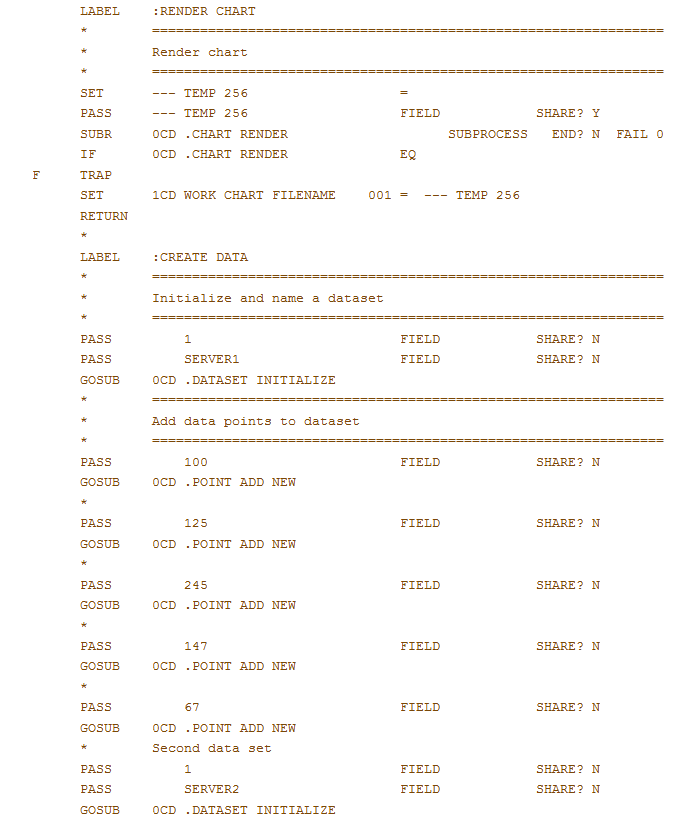
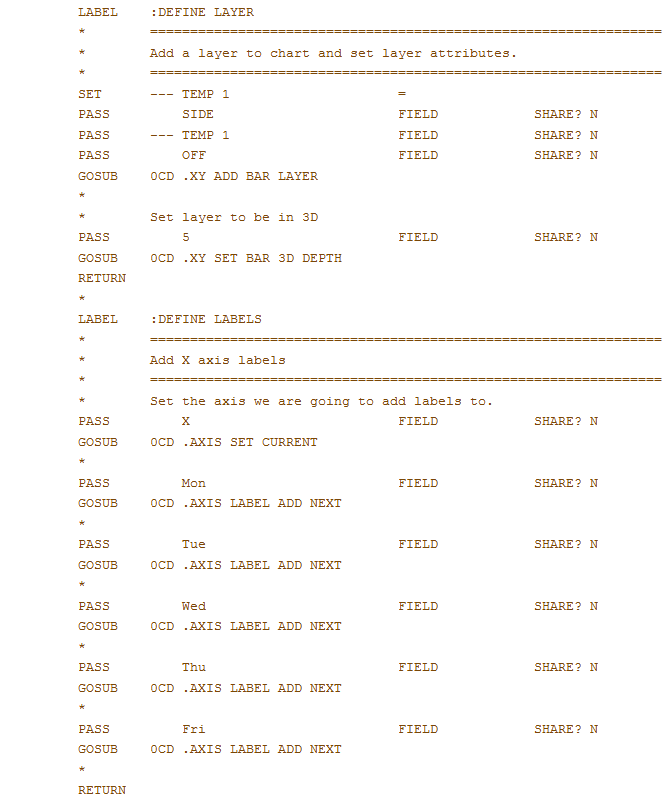
In this example, there was only one set of data, so the default names were used for creating and linking the data. A more complicated example would be where we have network usage for 3 different servers for a one week period (Mon - Fri). First we would initialize a 'data set' for one of the servers (possibly naming it 'SERVER1') via .DATASET INITIALIZE. Then we would add each days network usage for that server via .POINT ADD NEW. We would repeat the steps for the second and third server, naming each 'data set' as appropriate. We now have three 'data sets' that contain the 'data points' of the network usage for each server. To plot this on a bar chart, we would create a 'Layer' for our chart via .XY ADD BAR LAYER, then add a 'data group' via.LAYER ADD DATA GROUP. Next we would add 'data set templates' for each of the 3 servers via .LAYER ADD DATASET TM. This defines the presentation of our chart, without referring to the actual data. To add the data to our chart, would use .LAYER LINK DATASET TM to link our previously entered data with the 'data set templates. The following illustrates this example:
In this example, when we defined the data set templates, we gave each of them a name (DS1, DS2, DS3), and when we added our data sets, we gave each of them a name as well (SERVER1, SERVER2, SERVER3). We were then able to link the data set template with the data set via .LAYER LINK DATASET TM, passing it the specific names we wanted linked. If we wanted to render this chart with a different set of data, all we have to do is create 3 new data sets, relink them using .LAYER LINK DATASET TM, and then render the chart again. Notice when we called .XY ADD BAR LAYER, we passed the OFF parameter to suppress the automatic creation and linking of data groups, data set templates and data sets. Since we are managing this ourselves, we did not want the routine to do it for us. Also notice the technique of passing an empty field to .XY ADD BAR LAYER. We wanted to pass the first and third parameters, so we had to have a dummy field to pass as the second parameter (--- TEMP 1 in this case). Also notice the use of SUBR instead of GOSUB to call the chart rendering subroutine. That is a large process and compile times/sizes will be reduced if you call it as a separate process instead of including it in your process with a GOSUB. |
Application Design Manual "Powered by Appx Software"1269 ©2006 By APPX Software, Inc. All Rights Reserved |